Q25 EV Telemetry System: UDP, PyQt, and Simulated Data
Overview
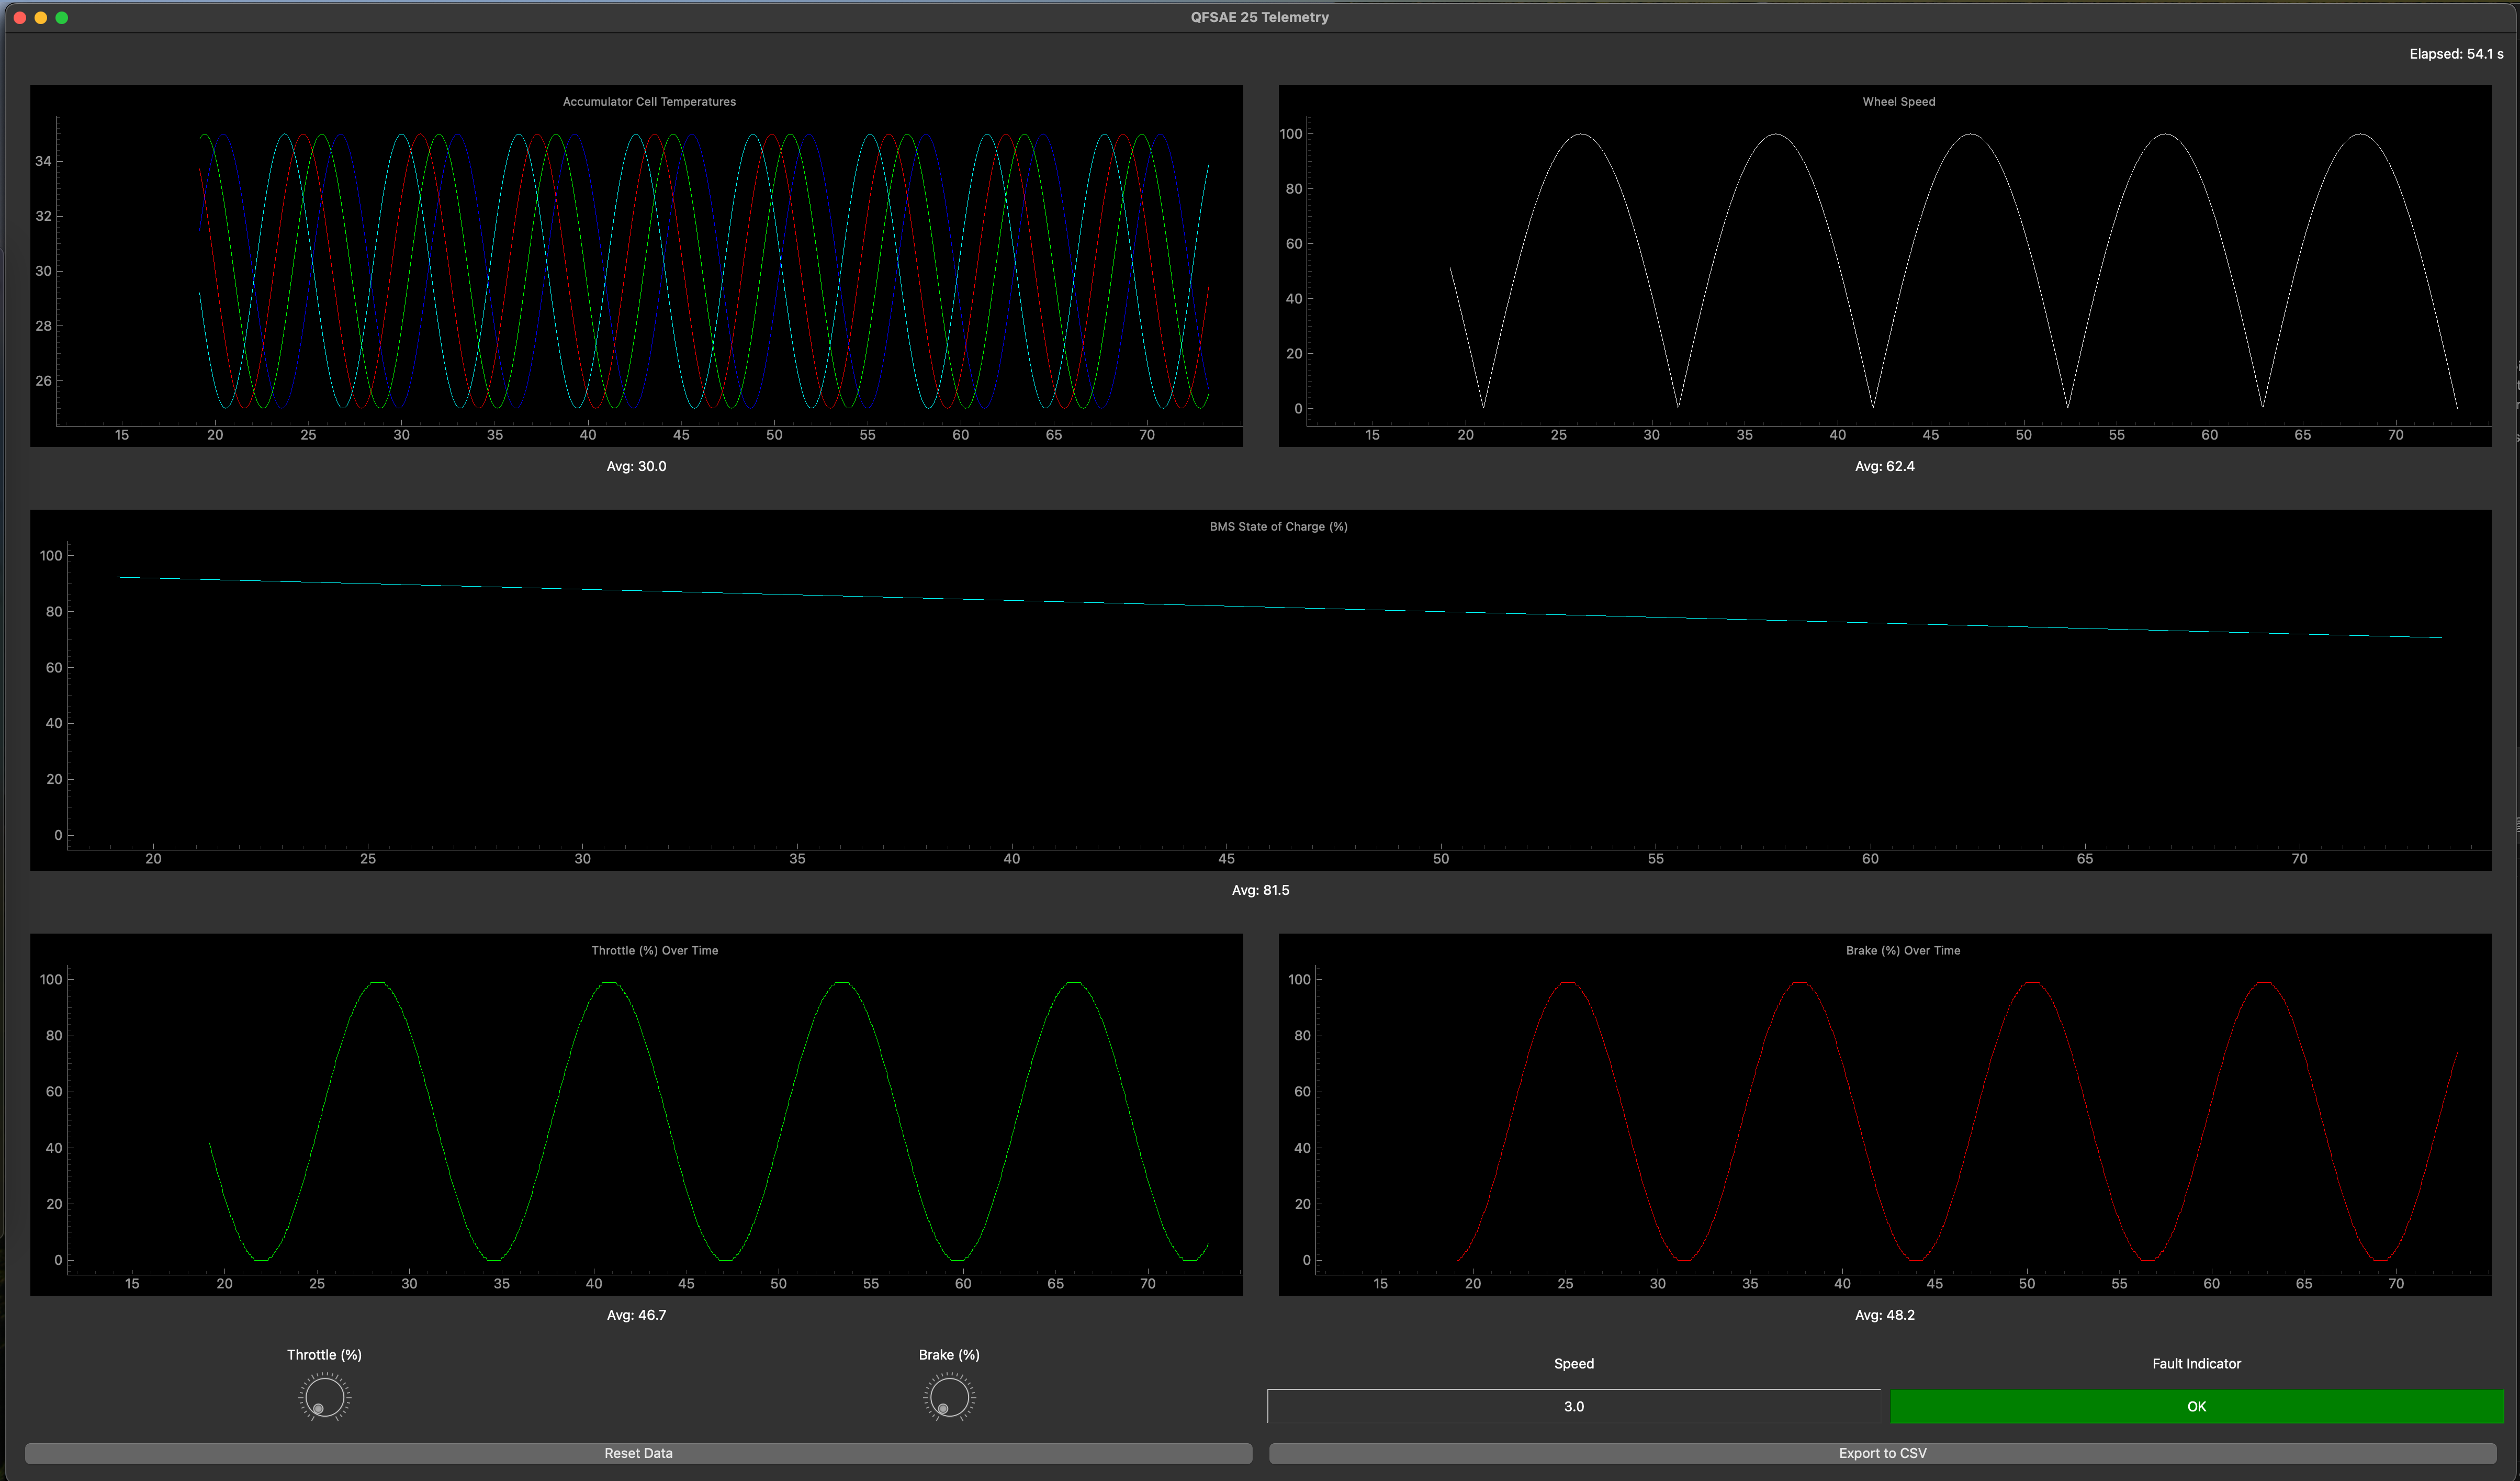
This post details the telemetry system I built for the Q25 EV program to support trackside monitoring and future diagnostics (including CAN decoding). The goal was to create a low-latency, portable GUI that we could use during initial setup debugging and test day tuning and health monitoring, while also serving as a foundation for a CAN-to-UDP gateway once the hardware path was fully validated.
Initially, I built thec GUI and tested it on simulated data until we could hook into real CAN frames coming from the car. The system was left partially complete because the inverter firmware wasn’t flashing correctly and persistent faults prevented full integration. However, this codebase combined with the CAN Architecture library I wrote in another post established the interfaces and architecture we needed for rapid integration once the physical layer stabilized.
Architecture Summary
- Transport: connectionless UDP JSON unicast (0.0.0.0:9999) for minimal latency and trivial deployment on a Wi‑Fi network broadcasting from the car
- UI: PyQt5 + pyqtgraph, 20 Hz data ingest, 50 ms GUI refresh cadence, rolling 60 s windows for time-series plots.
- Data model: explicit JSON schema (time, cell_temps, soc, wheel_speed, throttle, brake, speed, fault) consumed by a slot-thread boundary via Qt signals.
- Alerts + tooling: audible low-SOC warning, visual fault indicator, CSV export, session reset with timestamp realignment.
- Simulation: standalone UDP publisher that mimics car-side gateway behavior (sine/cosine waveforms, SOC decay, random transient faults).
This decoupled the GUI from data acquisition, mirroring the intended on-car architecture (embedded CAN reader -> UDP broadcaster -> trackside laptops decoding and displaying info on the GUI).
Data Flow End-to-End
1) UDP ingestion and thread-safe delivery to the UI
The GUI process binds a UDP socket and pushes decoded JSON telemetry into the Qt event loop using a signal emitter. This keeps all UI mutations on the GUI thread while allowing the network loop to run in a worker thread.
Exact snippet from telemetry/main.py:
import socket
import sys
import json
from PyQt5.QtWidgets import QApplication
from PyQt5.QtCore import QThread, pyqtSignal, QObject
from gui import TelemetryWindow

class SignalEmitter(QObject):
    newData = pyqtSignal(dict)

def main():
    app = QApplication(sys.argv)
    window = TelemetryWindow()
    window.show()

    emitter = SignalEmitter()
    emitter.newData.connect(window.updateTelemetry)

    host = "0.0.0.0"
    port = 9999
    running = True

    def udp_listner():
        server_socket = socket.socket(socket.AF_INET, socket.SOCK_DGRAM)
        server_socket.bind((host, port))
        while running:
            data, _ = server_socket.recvfrom(2048)
            telemetry_data = json.loads(data.decode("utf-8"))
            emitter.newData.emit(telemetry_data)

    udp_thread = QThread()
    udp_thread.run = udp_listner
    udp_thread.start()

    window.serverThread = udp_thread

    sys.exit(app.exec_())

if __name__ == '__main__':
    main()
- JSON is parsed immediately and sent across a Qt signal boundary, ensuring UI slots execute on the main thread.
2) Simulated car-side publisher (sine, cosine, and randomized faults)
During bring-up we exercised the GUI using a UDP publisher that generates realistic test patterns at 20 Hz. This mirrors the future car gateway which would decode raw CAN into the same JSON schema.
Exact snippet from telemetry/demo_data.py:
import socket
import json
import time
import math
import random

class DemoDataThread:
    def __init__(self, server_ip="127.0.0.1", server_port=9999):
        self.server_ip = server_ip
        self.server_port = server_port
        self.socket = socket.socket(socket.AF_INET, socket.SOCK_DGRAM)
        self.time_counter = 0.0
        self.soc_value = 100.0

    def generate_data_dict(self):
        # Sine wave for throttle (0 to 100)
        throttle = int((math.sin(self.time_counter * 0.5) + 1) * 50)

        # Cosine wave for brake (0 to 100)
        brake = int((math.cos(self.time_counter * 0.5) + 1) * 50)

        # Cell temperatures: ~30 +/- 5 using sine waves
        cell_temps = [30 + 5 * math.sin(self.time_counter + i) for i in range(4)]

        # Decrement SOC slowly but never below 0
        self.soc_value = max(0, self.soc_value - 0.02)

        # Wheel speed: cyclical in range ~0 to 100
        wheel_speed = abs(100 * math.sin(self.time_counter * 0.3))

        # Speed as a simple function of throttle
        speed = int(throttle * 0.5)

        # Fault: 1% random chance
        fault = 1 if random.random() < 0.01 else 0

        return {
            "time": self.time_counter,
            "cell_temps": cell_temps,
            "soc": self.soc_value,
            "wheel_speed": wheel_speed,
            "throttle": throttle,
            "brake": brake,
            "speed": speed,
            "fault": fault
        }

    def start(self):
        while True:
            data = self.generate_data_dict()
            self.socket.sendto(json.dumps(data).encode("utf-8"), (self.server_ip, self.server_port))
            time.sleep(0.05)
            self.time_counter += 0.05

if __name__ == "__main__":
    DemoDataThread().start()
Effective wire protocol (JSON schema):
{
  "time": 12.85,
  "cell_temps": [31.2, 29.8, 34.0, 30.6],
  "soc": 76.5,
  "wheel_speed": 42.7,
  "throttle": 63,
  "brake": 27,
  "speed": 31,
  "fault": 0
}
This schema is intentionally simple; the Q25 CAN Abstraction Layer (CAL) lays the framework to access hardware sensor and state values in their objects. This way decoding doesnt have to be done again. A thread will subscribe to relevant or interesting values and broadcast them to the GUI.
3) UI ingestion, state, plots, and alerts
The GUI maintains per-channel time series, computes windowed averages, renders plots, and triggers alerts. The core slot is updateTelemetry.
Exact snippet from telemetry/gui.py:
@pyqtSlot(dict)
def updateTelemetry(self, data):
    # Get the raw timestamp from the incoming data.
    raw_timestamp = data.get("time", len(self.time_data))
    # Compute effective time relative to the current offset.
    effective_timestamp = raw_timestamp - self.time_offset
    self.time_data.append(effective_timestamp)
    # Store the last raw time for reset purposes.
    self.last_raw_time = raw_timestamp
    if len(self.time_data) == 1:
        self.startTime = effective_timestamp

    # Cell temperatures
    cell_temps = data.get("cell_temps", [0 for _ in range(num_BMS_sensors)])
    for i in range(len(cell_temps)):
        self.cell_temp_data[i].append(cell_temps[i])

    # SOC
    soc = data.get("soc", 0)
    self.soc_data.append(soc)
    if soc < 10:
        self.warningLight.show()
        self.beepSound.play()
    else:
        self.warningLight.hide()

    # Wheel speed
    wheel_speed = data.get("wheel_speed", 0)
    self.wheel_speed_data.append(wheel_speed)

    # Throttle
    throttle = data.get("throttle", 0)
    self.throttle_data.append(throttle)

    # Brake
    brake = data.get("brake", 0)
    self.brake_data.append(brake)

    # Speed (numeric display)
    speed = data.get("speed", 0)
    self.speedValueLabel.setText(f"{speed:.1f}")

    # Fault
    fault = data.get("fault", 0)
    if fault:
        self.faultStatus.setText("FAULT!")
        self.faultStatus.setStyleSheet("background-color: red; color: white;")
    else:
        self.faultStatus.setText("OK")
        self.faultStatus.setStyleSheet("background-color: green; color: white;")
Plot refresh and statistics are computed every 50 ms, with a 60 s rolling window for most channels:
def updatePlots(self):
    if not self.time_data:
        return

    current_time = self.time_data[-1]
    xmin = max(current_time - 60, 0)

    # Update cell temperature curves and average
    for i, curve in enumerate(self.cellTemp_curves):
        curve.setData(self.time_data, self.cell_temp_data[i])
    self.cellTempPlot.setXRange(xmin, current_time)
    avgTemps = []
    for i in range(num_BMS_sensors):
        temps_in_window = [temp for j, temp in enumerate(self.cell_temp_data[i]) if self.time_data[j] >= xmin]
        if temps_in_window:
            avgTemps.append(sum(temps_in_window) / len(temps_in_window))
    avgTemp = sum(avgTemps) / len(avgTemps) if avgTemps else 0
    self.cellTempStat.setText(f"Avg: {avgTemp:.1f}")

    # Update wheel speed
    self.wheelSpeedCurve.setData(self.time_data, self.wheel_speed_data)
    self.wheelSpeedPlot.setXRange(xmin, current_time)
    speeds_in_window = [speed for j, speed in enumerate(self.wheel_speed_data) if self.time_data[j] >= xmin]
    avgSpeed = sum(speeds_in_window) / len(speeds_in_window) if speeds_in_window else 0
    self.wheelSpeedStat.setText(f"Avg: {avgSpeed:.1f}")

    # SOC plot: full timeline
    self.socCurve.setData(self.time_data, self.soc_data)
    avgSOC = sum(self.soc_data) / len(self.soc_data) if self.soc_data else 0
    self.socStat.setText(f"Avg: {avgSOC:.1f}")

    # Update throttle
    self.throttleCurve.setData(self.time_data, self.throttle_data)
    self.throttlePlot.setXRange(xmin, current_time)
    throttles_in_window = [val for j, val in enumerate(self.throttle_data) if self.time_data[j] >= xmin]
    avgThrottle = sum(throttles_in_window) / len(throttles_in_window) if throttles_in_window else 0
    self.throttleStat.setText(f"Avg: {avgThrottle:.1f}")

    # Update brake
    self.brakeCurve.setData(self.time_data, self.brake_data)
    self.brakePlot.setXRange(xmin, current_time)
    brakes_in_window = [val for j, val in enumerate(self.brake_data) if self.time_data[j] >= xmin]
    avgBrake = sum(brakes_in_window) / len(brakes_in_window) if brakes_in_window else 0
    self.brakeStat.setText(f"Avg: {avgBrake:.1f}")
Session reset realigns timestamps so new data starts at t=0 without forcing the sender to reset its counter. Exact snippet:
def resetData(self):
    # Set the time_offset to the last received raw time so that the next incoming
    # data point's effective time will be zero.
    self.time_offset = self.last_raw_time if hasattr(self, "last_raw_time") else 0.0

    # Use UDP-based reset if available
    if hasattr(self, "sendResetCommand"):
        self.sendResetCommand()

    # Clear data storage
    self.time_data.clear()
    self.cell_temp_data = [[] for _ in range(num_BMS_sensors)]
    self.soc_data.clear()
    self.wheel_speed_data.clear()
    self.throttle_data.clear()
    self.brake_data.clear()
    self.startTime = 0.0

    # Clear plots
    self.cellTempPlot.clear()
    self.wheelSpeedPlot.clear()
    self.socPlot.clear()
    self.throttlePlot.clear()
    self.brakePlot.clear()

    # Recreate curves after clearing plots
    self.cellTemp_curves = []
    colors = ['b', 'g', 'r', 'c', 'm', 'y', 'k', 'w'][:num_BMS_sensors]
    for i in range(num_BMS_sensors):
        curve = self.cellTempPlot.plot([], [], pen=colors[i], name=f"Cell {i+1}")
        self.cellTemp_curves.append(curve)
    self.wheelSpeedCurve = self.wheelSpeedPlot.plot([], [], pen='w')
    self.socCurve = self.socPlot.plot([], [], pen='c')
    self.throttleCurve = self.throttlePlot.plot([], [], pen='g')
    self.brakeCurve = self.brakePlot.plot([], [], pen='r')
CSV export provides an offline analysis path:
def exportData(self):
    filename = datetime.now().strftime("telemetry_%Y%m%d_%H%M%S.csv")
    with open(filename, mode="w", newline="") as csv_file:
        writer = csv.writer(csv_file)
        # Write header
        writer.writerow(["Time", "BMS", "SOC", "Wheel Speed", "Throttle%", "Brake%"])
        for i, t in enumerate(self.time_data):
            cell_temps = [self.cell_temp_data[j][i] if i < len(self.cell_temp_data[j]) else "" for j in range(num_BMS_sensors)]
            writer.writerow([
                t,
                cell_temps,
                self.soc_data[i] if i < len(self.soc_data) else "",
                self.wheel_speed_data[i] if i < len(self.wheel_speed_data) else "",
                self.throttle_data[i] if i < len(self.throttle_data) else "",
                self.brake_data[i] if i < len(self.brake_data) else ""
            ])
    print(f"Exported data to {filename}")
Finally, low-SOC alerting uses an audio cue and an orange banner:
# Low battery sound
self.beepSound = QSoundEffect()
self.beepSound.setSource(QUrl.fromLocalFile("assets/lowBattery.wav"))
Why UDP for Trackside?
- No connection setup/teardown overhead; publisher can broadcast as soon as the car powers up.
- Packet loss tolerance (telemetry is lossy; the next packet will arrive in 50 ms).
- Easy multi-client fan-out using unicast or (future) multicast.
The workflow aligns well with a “watch live, save critical events, don’t block the car” mindset.
From CAN to GUI: The Intended Gateway
The next step is a small “CAN gateway” process on the car which subscribes to specific interesting member variable values for each car hardware object in the CAN Architecture library, encapsulaiting it into json and sending this over UDP to the telemetry GUI. The GUI will then show the json in a pretty format.
Issues and Future Improvements
The current setup is good for bring-up and short test sessions, but once we’re logging hours of real track data we’ll need smarter ways of handling storage, memory, and fidelity. A few directions I’ve been thinking about:
- Selective logging by signal type: Right now everything is saved at the same cadence, which wastes space. High-frequency signals like throttle, brake, and wheel speed should stay high resolution to capture transients, but slower ones (SOC, pack temps) could be logged only when they change past a threshold or at a low periodic rate. That would shrink file sizes while keeping the important details.
- Rolling windows and memory limits: The GUI keeps a full history in memory, which is fine for a minute or two but will bog down if left running all day. A better approach is per-channel rolling windows (e.g. 30s for driver inputs, several minutes for temps) with older data summarized and flushed to disk. Downsampling to min/max/avg per interval would keep plots readable without holding everything in RAM.
- Event-driven persistence: Faults, mode changes, and operator actions should always be saved in full detail with timestamps, regardless of sampling policies. That way we can reconstruct the exact sequence around failures instead of guessing from sparse data.
- Configurable per-channel settings: Ideally, window length, sampling rate, and logging policy could be adjusted at runtime or per session. Engineers tuning control loops may want tight windows, while long-term diagnostics benefit from slower but continuous streams.
- Archiving and post-processing: For long sessions, it would make sense to export older data into compact time-series files (CSV or something more efficient) so we can reload them later for analysis. Having metadata about when trimming/downsampling occurred would also help with reproducibility.
- Performance monitoring: Exposing basic stats in the UI (point counts, memory use, when downsampling kicked in) would give feedback on how much detail is being preserved versus thrown away.
In short, the next big step is making the system adaptive: preserve fidelity where it matters, compress where it doesn’t, and always log events with context. That balance will keep the GUI responsive during live testing while still giving us solid datasets for post-mortem analysis.
Status and Lessons
-
Status: The core pipeline (GUI + UDP transport + simulator) is functional and a great framework. The CAN gateway piece is designed but wasn’t fully implemented yet in the CAL library.
- What worked well:
- Decoupling acquisition (UDP publisher) from visualization (GUI) allowed us to exercise the frontend without waiting for hardware to behave.
- The JSON schema provided a clear contract between sender and receiver, which will make swapping in the CAN gateway almost trivial.
- The simulator turned out to be more valuable than expected; it gave us a safe way to stress test the UI and confirm alerting logic.
- Challenges:
- Memory pressure showed up quickly once the GUI had been running for a while — especially with rolling windows holding every single point.
- File exports grew large fast because every field was logged at the same cadence.
- Fault handling worked, but we didn’t yet have a way to guarantee that events were preserved in full resolution while other channels were downsampled.
- Lack of configurability in logging and plotting meant engineers couldn’t easily adjust history length or sampling policies on the fly.
- Lessons and future direction:
- Smarter logging is essential. Not all signals deserve equal fidelity. Throttle and brake need to capture transients in detail, while SOC and pack temps can be checkpointed more sparsely.
- Memory management needs to be proactive. Rolling windows per channel, downsampling older data, and flushing summaries to disk will keep the GUI snappy even during long test sessions.
- Events should always take priority. Faults, mode changes, and operator actions should bypass rate limits so we never lose context around failures.
- Configurability is key. Giving engineers per-channel knobs (window size, sampling cadence, retention policy) will make the tool more flexible for different use cases — from quick driver tuning to multi-hour endurance runs.
- Visibility into the system itself matters. Showing when downsampling/trimming happens, or how many points are being held in memory, will make logs more trustworthy for later analysis.
Takeaway: The project delivered a usable telemetry framework and a clear roadmap for future years. The separation of concerns (gateway vs GUI), choice of UDP for lightweight transport, and use of simulated data were all validated. The next evolution is about efficiency and resilience: trimming what we don’t need, protecting what we do, and giving engineers the tools to control the tradeoff in real time.